# 使用调试器工具
> 学习如何使用开发者工具里的调试器。
:::note
DevTools hides the Debugger tab if the app was launched
from VS Code because VS Code has a built-in debugger.
如果应用是从 VS Code 启动的,开发工具会隐藏调试器标签页,
因为 VS Code 有内置的调试器。
:::
## Getting started
## 开始使用
DevTools includes a full source-level debugger,
supporting breakpoints, stepping, and variable inspection.
开发工具中包含了一个完整的源码级调试器,支持断点、单步调试以及变量检视。
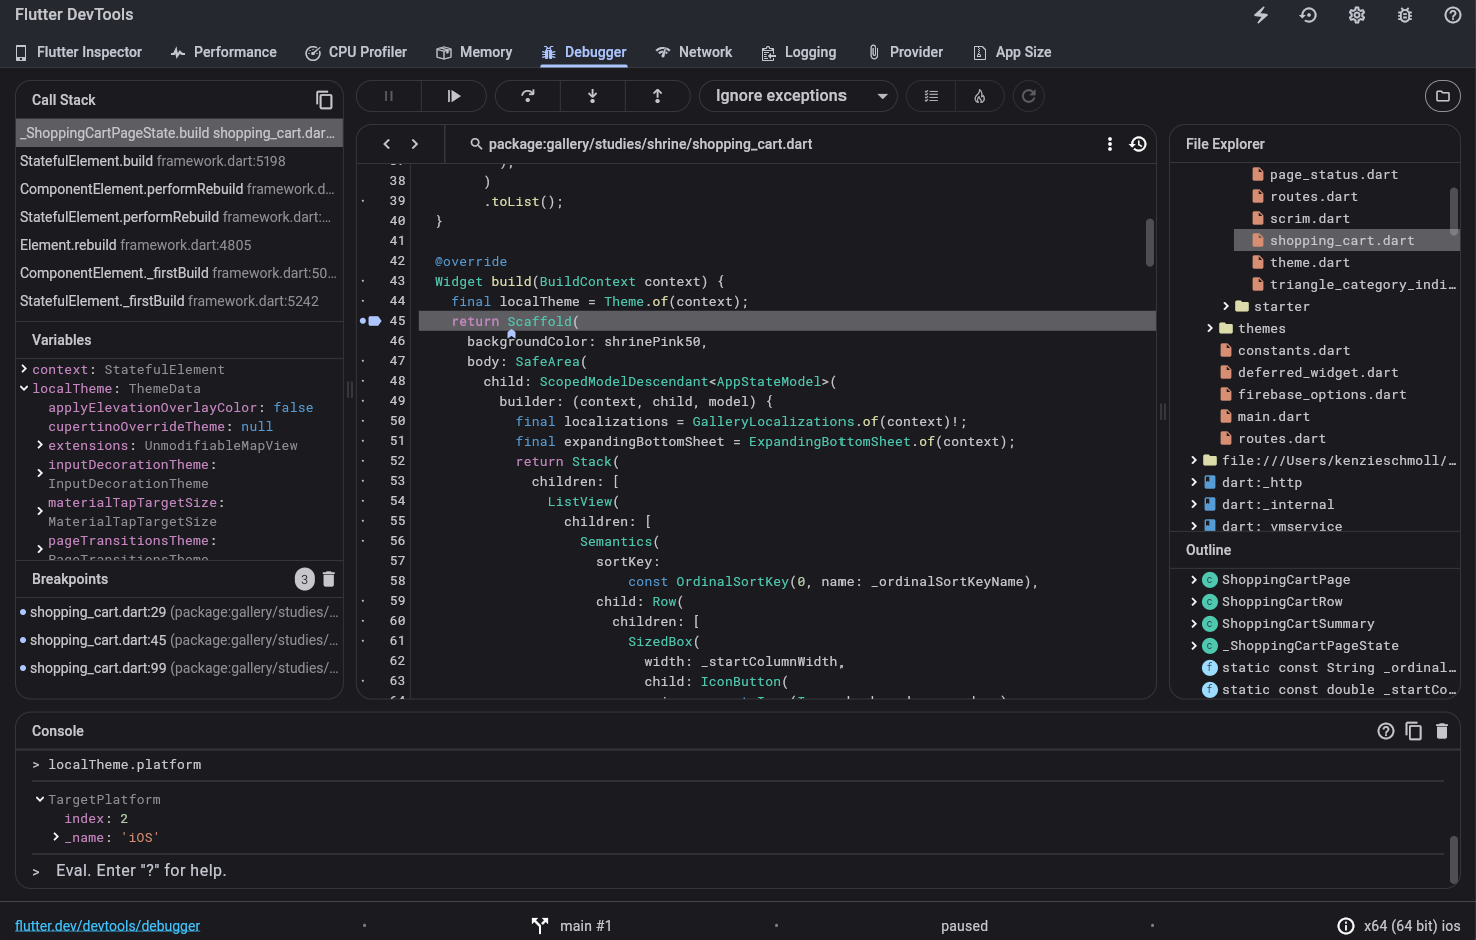
When you open the debugger tab, you should see the source for the main
entry-point for your app loaded in the debugger.
当你打开调试器标签页时,你应该会看到你的应用入口点的源码已经加载到了调试器中。
In order to browse around more of your application sources, click **Libraries**
(top right) or press Ctrl / Cmd + P.
This opens the libraries window and allows you
to search for other source files.
为了浏览更多的应用源码,点击 **Libraries**(右上角)或者使用快捷键 `⌘ + P` / `ctrl + P`。
这会打开库窗口并让你搜索其他源文件。
{:width="100%"}
## Setting breakpoints
## 设置断点
To set a breakpoint, click the left margin (the line number ruler)
in the source area. Clicking once sets a breakpoint, which should
also show up in the **Breakpoints** area on the left. Clicking
again removes the breakpoint.
可以点击源码区左边空白(行数展示栏内)来设置断点。
单击一次就设置了一个断点,并且也会在 **Breakpoints** 区域展示出来。
再次单击则取消断点。
## The call stack and variable areas
## 调用栈和变量区
When your application encounters a breakpoint, it pauses there,
and the DevTools debugger shows the paused execution location
in the source area. In addition, the `Call stack` and `Variables`
areas populate with the current call stack for the paused isolate,
and the local variables for the selected frame. Selecting other
frames in the `Call stack` area changes the contents of the variables.
当应用运行到某个断点时,就会在此处暂停,调试器也会在源码区显示当前暂停的位置。
此外,`Call stack` 和 `Variables` 区域也会显示暂停时的调用栈以及选中帧的本地变量。
在 `Call stack` 选择其他的帧可以改变变量区的内容。
Within the `Variables` area, you can inspect individual objects by
toggling them open to see their fields. Hovering over an object
in the `Variables` area calls `toString()` for that object and
displays the result.
在 `Variables` 内,可以通过点击对象展开查看其内容来检视独立的对象。
指针停在 `Variables` 区域的对象上时会调用该对象的 `toString()` 方法并展示结果。
## Stepping through source code
## 单步调试源码
When paused, the three stepping buttons become active.
三个单步调试按钮在暂停后会变为可用状态。
* Use **Step in** to step into a method invocation, stopping at
the first executable line in that invoked method.
使用 **Step in** 来进入被调用的方法,在遇到方法内的第一行可执行代码时结束。
* Use **Step over** to step over a method invocation;
this steps through source lines in the current method.
使用 **Step over** 直接执行某个方法调用而不进入内部;该按钮在当前方法内按行执行。
* Use **Step out** to step out of the current method,
without stopping at any intermediary lines.
使用 **Step out** 来跳出当前方法,这种方式会直接执行完所有当前方法内的语句。
In addition, the **Resume** button continues regular
execution of the application.
另外,**Resume** 按钮的作用是恢复应用的正常执行。
## Console output
## 命令行输出
Console output for the running app (stdout and stderr) is
displayed in the console, below the source code area.
You can also see the output in the [Logging view][].
运行中应用的命令行输出(stdout 和 stderr)会在命令行中输出,
该区域在源代码区下方。[Logging view][] 中也可以看到相应输出。
## Breaking on exceptions
## 异常跳出
To adjust the stop-on-exceptions behavior, toggle the
**Ignore** dropdown at the top of the debugger view.
请在调试器视图顶部切换 **Ignore** 下拉菜单来
适配异常跳出的行为。
Breaking on unhandled excepts only pauses execution if the
breakpoint is considered uncaught by the application code.
Breaking on all exceptions causes the debugger to pause
whether or not the breakpoint was caught by application code.
Break on unhandled exceptions:只在断点被认为应用内代码无法捕获时暂停执行。
Breaking on all exceptions:无论是否被捕获都会暂停执行。
## Known issues
## 已知问题
When performing a hot restart for a Flutter application,
user breakpoints are cleared.
当 Flutter 应用执行热重载时,用户的断点会被清除。
[Logging view]: /tools/devtools/logging
## Other resources
## 其他资源
For more information on debugging and profiling, see the
[Debugging][] page.
访问 [调试][Debugging] 页面来获取更多关于调试器和性能分析的信息。
[Debugging]: /testing/debugging