# 使用旧版 Flutter 检查器
> 学习如何使用旧版 Flutter 检查器探索 Flutter 应用的 widget 树。
:::warning
The legacy inspector will be removed in a future release.
Let us know if there are issues preventing you from
using the [new inspector][] by [filing a bug][].
旧版检查器将在未来版本中移除。
若有问题导致你无法使用 [新检查器][new inspector],请通过 [提交 bug][filing a bug] 告知我们。
:::
[new inspector]: /tools/devtools/inspector
[filing a bug]: https://github.com/flutter/devtools/issues/new
## The legacy Flutter inspector
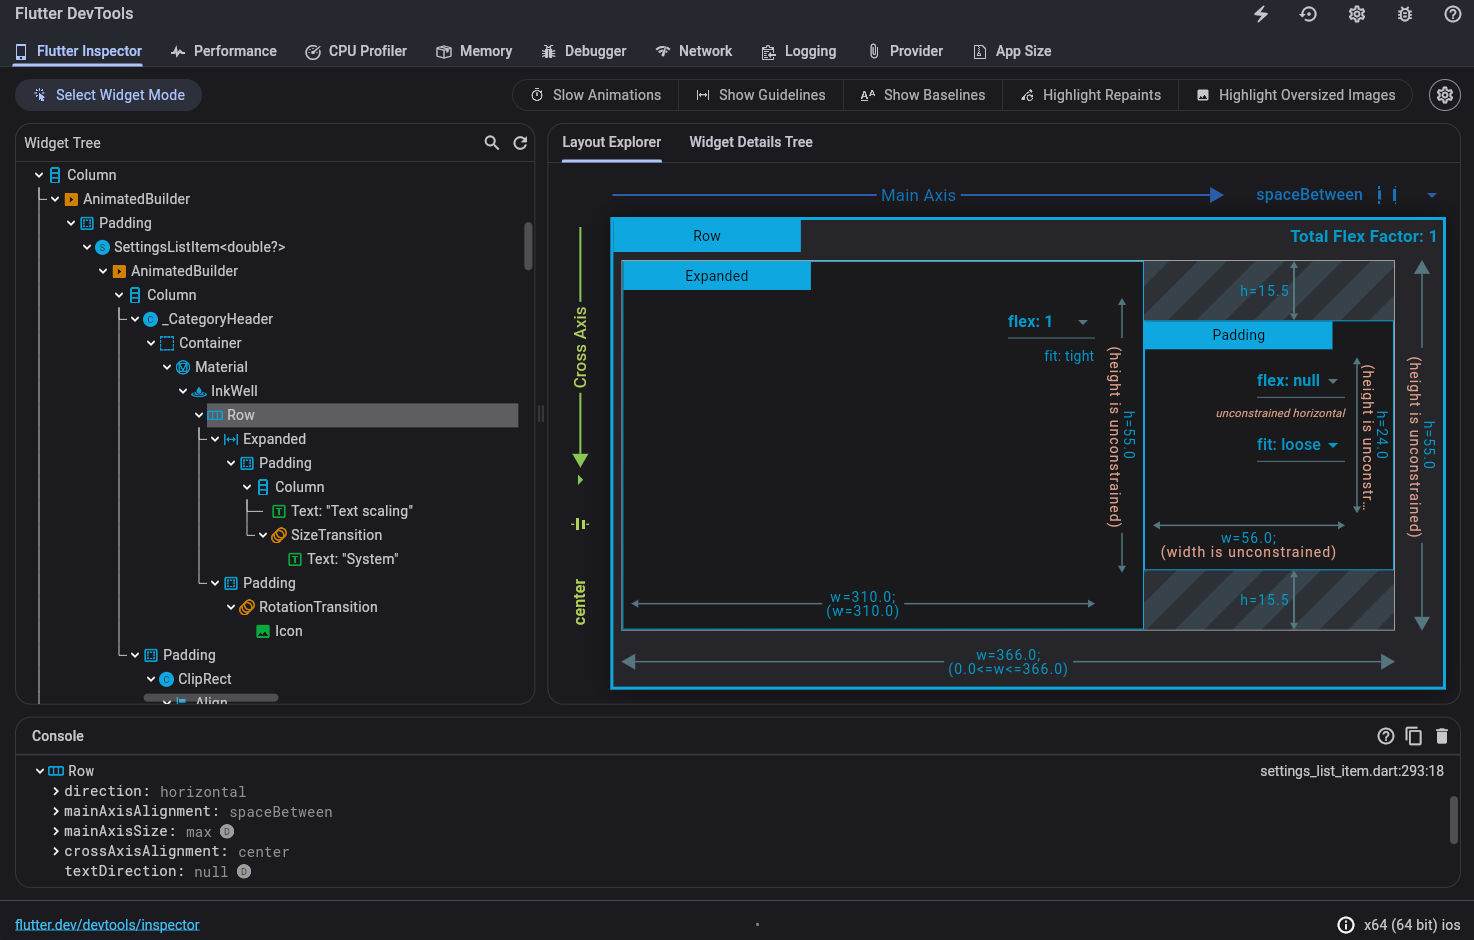
## 旧版 Flutter 检查器
{:width="100%"}
### Debugging layout issues visually
### 可视化调试布局问题
The following is a guide to the features available in the
inspector's toolbar. When space is limited, the icon is
used as the visual version of the label.
以下是检查器工具栏中可用功能的指南。
空间有限时,将使用图标代替文字标签。
{:width="20px"} **Select widget mode**
Enable this button in order to select
a widget on the device to inspect it. To learn more,
check out [Inspecting a widget](#inspecting-a-widget).
{:width="20px"} **选择 widget 模式**
启用此按钮以在设备上选择 widget 进行检查。
了解更多请参阅 [检查 widget](#inspecting-a-widget)。
{:width="20px"} **Refresh tree**
Reload the current widget info.
{:width="20px"} **刷新树**
重新加载当前 widget 信息。
{:width="20px"} **[Slow animations][]**
Run animations 5 times slower to help fine-tune them.
{:width="20px"} **[慢速动画][Slow animations]**
以 5 倍慢速运行动画,便于微调。
{:width="20px"} **[Show guidelines][]**
Overlay guidelines to assist with fixing layout issues.
{:width="20px"} **[显示参考线][Show guidelines]**
叠加参考线以辅助修复布局问题。
{:width="20px"} **[Show baselines][]**
Show baselines, which are used for aligning text.
Can be useful for checking if text is aligned.
{:width="20px"} **[显示基线][Show baselines]**
显示用于对齐文本的基线。
可用于检查文本是否对齐。
{:width="20px"} **[Highlight repaints][]**
Show borders that change color when elements repaint.
Useful for finding unnecessary repaints.
{:width="20px"} **[高亮重绘][Highlight repaints]**
在元素重绘时显示变色边框。
有助于发现不必要的重绘。
{:width="20px"} **[Highlight oversized images][]**
Highlights images that are using too much memory
by inverting colors and flipping them.
{:width="20px"} **[高亮过大图片][Highlight oversized images]**
通过反色并翻转来高亮占用过多内存的图片。
[Slow animations]: #slow-animations
[Show guidelines]: #show-guidelines
[Show baselines]: #show-baselines
[Highlight repaints]: #highlight-repaints
[Highlight oversized images]: #highlight-oversized-images
## Inspecting a widget
## 检查 widget
You can browse the interactive widget tree to view nearby
widgets and see their field values.
你可以浏览交互式 widget 树,查看相邻 widget 及其字段值。
To locate individual UI elements in the widget tree,
click the **Select Widget Mode** button in the toolbar.
This puts the app on the device into a "widget select" mode.
Click any widget in the app's UI; this selects the widget on the
app's screen, and scrolls the widget tree to the corresponding node.
Toggle the **Select Widget Mode** button again to exit
widget select mode.
要在 widget 树中定位单个 UI 元素,
请点击工具栏中的 **Select Widget Mode**(选择 widget 模式)按钮。
这会将设备上的应用置于「widget 选择」模式。
点击应用 UI 中的任意 widget;会在应用屏幕上选中该 widget,
并将 widget 树滚动到对应节点。
再次切换 **Select Widget Mode** 按钮可退出 widget 选择模式。
When debugging layout issues, the key fields to look at are the
`size` and `constraints` fields. The constraints flow down the tree,
and the sizes flow back up. For more information on how this works,
see [Understanding constraints][].
调试布局问题时,关键字段是 `size` 和 `constraints`。
约束沿树向下传递,尺寸向上回传。
更多信息请参阅 [Understanding constraints][](理解约束)。
## Flutter Layout Explorer
## Flutter 布局浏览器
The Flutter Layout Explorer helps you to better understand
Flutter layouts.
Flutter 布局浏览器(Layout Explorer)帮助你更好地理解 Flutter 布局。
For an overview of what you can do with this tool, see
the Flutter Explorer video:
有关此工具功能的概览,请参阅 Flutter Explorer 视频:
You might also find the following step-by-step article useful:
你可能还会觉得以下分步文章很有用:
* [How to debug layout issues with the Flutter Inspector][debug-article]
[如何使用 Flutter 检查器调试布局问题][debug-article]
[debug-article]: https://blog.flutter.dev/how-to-debug-layout-issues-with-the-flutter-inspector-87460a7b9db
### Use the Layout Explorer
### 使用布局浏览器
From the Flutter Inspector, select a widget. The Layout Explorer
supports both [flex layouts][] and fixed size layouts, and has
specific tooling for both kinds.
在 Flutter 检查器中选择 widget。布局浏览器
支持 [flex layouts][](flex 布局)和固定尺寸布局,并为两者提供专用工具。
#### Flex layouts
#### Flex 布局
When you select a flex widget (for example, [`Row`][], [`Column`][], [`Flex`][])
or a direct child of a flex widget, the flex layout tool will
appear in the Layout Explorer.
当你选择 flex widget(例如 [`Row`][]、[`Column`][]、[`Flex`][])
或 flex widget 的直接子节点时,flex 布局工具会出现在布局浏览器中。
The Layout Explorer visualizes how [`Flex`][] widgets and their
children are laid out. The explorer identifies the main axis
and cross axis, as well as the current alignment for each
(for example, start, end, and spaceBetween).
It also shows details like flex factor, flex fit, and layout
constraints.
布局浏览器可视化 [`Flex`][] widget 及其子节点的布局方式。
它会标识主轴与交叉轴,以及当前对齐方式
(例如 start、end、spaceBetween)。
还会显示 flex 因子、flex fit 和布局约束等细节。

Additionally, the explorer shows layout constraint violations
and render overflow errors. Violated layout constraints
are colored red, and overflow errors are presented in the
standard "yellow-tape" pattern, as you might see on a running
device. These visualizations aim to improve understanding of
why overflow errors occur as well as how to fix them.
此外,浏览器会显示布局约束违规和渲染溢出错误。
违规的布局约束标为红色,溢出错误以运行设备上常见的
标准「黄黑警示条」图案呈现。
这些可视化旨在帮助你理解溢出错误的原因及修复方法。
{:width="100%"}
Clicking a widget in the layout explorer mirrors
the selection on the on-device inspector. **Select Widget Mode**
needs to be enabled for this. To enable it,
click on the **Select Widget Mode** button in the inspector.
在布局浏览器中点击 widget 会同步设备上检查器的选中项。
需要启用 **Select Widget Mode**(选择 widget 模式)。
请点击检查器中的 **Select Widget Mode** 按钮以启用。

For some properties, like flex factor, flex fit, and alignment,
you can modify the value via dropdown lists in the explorer.
When modifying a widget property, you see the new value reflected
not only in the Layout Explorer, but also on the
device running your Flutter app. The explorer animates
on property changes so that the effect of the change is clear.
Widget property changes made from the layout explorer don't
modify your source code and are reverted on hot reload.
对于 flex 因子、flex fit 和对齐等部分属性,
可通过浏览器中的下拉列表修改值。
修改 widget 属性时,新值不仅反映在布局浏览器中,
也反映在运行 Flutter 应用的设备上。
属性变更时浏览器会播放动画,使效果更清晰。
从布局浏览器所做的 widget 属性更改不会修改源码,热重载后会还原。
##### Interactive Properties
##### 交互式属性
Layout Explorer supports modifying [`mainAxisAlignment`][],
[`crossAxisAlignment`][], and [`FlexParentData.flex`][].
In the future, we may add support for additional properties
such as [`mainAxisSize`][], [`textDirection`][], and
[`FlexParentData.fit`][].
布局浏览器支持修改 [`mainAxisAlignment`][]、[`crossAxisAlignment`][] 和 [`FlexParentData.flex`][]。
未来可能增加对 [`mainAxisSize`][]、[`textDirection`][] 和 [`FlexParentData.fit`][] 等属性的支持。
###### mainAxisAlignment
{:width="100%"}
Supported values:
支持的值:
* `MainAxisAlignment.start`
* `MainAxisAlignment.end`
* `MainAxisAlignment.center`
* `MainAxisAlignment.spaceBetween`
* `MainAxisAlignment.spaceAround`
* `MainAxisAlignment.spaceEvenly`

###### crossAxisAlignment
{:width="100%"}
Supported values:
支持的值:
* `CrossAxisAlignment.start`
* `CrossAxisAlignment.center`
* `CrossAxisAlignment.end`
* `CrossAxisAlignment.stretch`

###### FlexParentData.flex
{:width="100%"}
Layout Explorer supports 7 flex options in the UI
(null, 0, 1, 2, 3, 4, 5), but technically the flex
factor of a flex widget's child can be any int.
布局浏览器在 UI 中提供 7 个 flex 选项(null、0、1、2、3、4、5),
但技术上 flex widget 子节点的 flex 因子可以是任意 int。

###### Flexible.fit
{:width="100%"}
Layout Explorer supports the two different types of
[`FlexFit`][]: `loose` and `tight`.
布局浏览器支持 [`FlexFit`][] 的两种类型:`loose` 和 `tight`。
#### Fixed size layouts
#### 固定尺寸布局
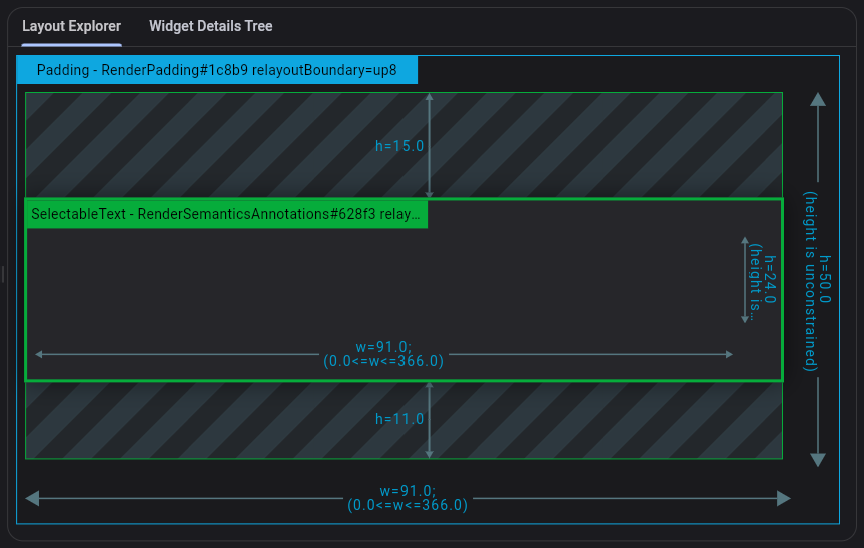
When you select a fixed size widget that is not a child
of a flex widget, fixed size layout information will appear
in the Layout Explorer. You can see size, constraint, and padding
information for both the selected widget and its nearest upstream
RenderObject.
当你选择的固定尺寸 widget 不是 flex widget 的子节点时,
布局浏览器会显示固定尺寸布局信息。
你可以查看所选 widget 及其最近上游 RenderObject 的尺寸、约束和内边距信息。
{:width="100%"}
## Visual debugging
## 可视化调试
The Flutter Inspector provides several options for visually debugging your app.
Flutter 检查器提供多种可视化调试应用的选项。
{:width="100%"}
### Slow animations
### 慢速动画
When enabled, this option runs animations 5 times slower for easier visual
inspection.
This can be useful if you want to carefully observe and tweak an animation that
doesn't look quite right.
启用后,动画将以 5 倍慢速运行,便于视觉检查。
若需仔细观察并微调看起来不太对的动画,这会很有用。
This can also be set in code:
也可以在代码中设置:
```dart
import 'package:flutter/scheduler.dart';
void setSlowAnimations() {
timeDilation = 5.0;
}
```
This slows the animations by 5x.
这会将动画减慢 5 倍。
#### See also
#### 另请参阅
The following links provide more info.
以下链接提供更多信息。
* [Flutter documentation: timeDilation property](https://api.flutter-io.cn/flutter/scheduler/timeDilation.html)
[Flutter 文档:timeDilation 属性](https://api.flutter-io.cn/flutter/scheduler/timeDilation.html)

The following screen recordings show before and after slowing an animation.
以下录屏展示减慢动画前后的效果。

### Show guidelines
### 显示参考线
This feature draws guidelines over your app that display render boxes, alignments,
paddings, scroll views, clippings and spacers.
此功能在应用上绘制参考线,显示 render box、对齐、内边距、滚动视图、裁剪和 spacer。
This tool can be used for better understanding your layout. For instance,
by finding unwanted padding or understanding widget alignment.
此工具有助于理解布局,例如发现多余内边距或理解 widget 对齐。
You can also enable this in code:
也可以在代码中启用:
```dart
import 'package:flutter/rendering.dart';
void showLayoutGuidelines() {
debugPaintSizeEnabled = true;
}
```
#### Render boxes
#### Render box(渲染框)
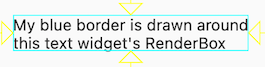
Widgets that draw to the screen create a [render box][], the
building blocks of Flutter layouts. They're shown with a bright blue border:
绘制到屏幕的 widget 会创建 [render box][],即 Flutter 布局的基本构建块。它们以亮蓝色边框显示:
#### Alignments
#### 对齐
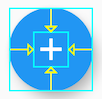
Alignments are shown with yellow arrows. These arrows show the vertical
and horizontal offsets of a widget relative to its parent.
For example, this button's icon is shown as being centered by the four arrows:
对齐以黄色箭头显示,表示 widget 相对于父级的垂直与水平偏移。
例如,此按钮图标由四支箭头显示为居中:
#### Padding
#### 内边距
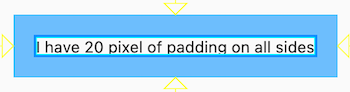
Padding is shown with a semi-transparent blue background:
内边距以半透明蓝色背景显示:
#### Scroll views
#### 滚动视图
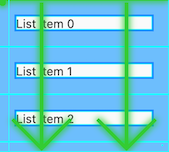
Widgets with scrolling contents (such as list views) are shown with green arrows:
具有滚动内容的 widget(如列表视图)以绿色箭头显示:
#### Clipping
#### 裁剪
Clipping, for example when using the [ClipRect widget][], are shown
with a dashed pink line with a scissors icon:
裁剪(例如使用 [ClipRect widget][] 时)以带剪刀图标的粉色虚线显示:
[ClipRect widget]: https://api.flutter-io.cn/flutter/widgets/ClipRect-class.html

#### Spacers
#### Spacer(间隔)
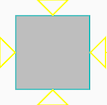
Spacer widgets are shown with a grey background,
such as this `SizedBox` without a child:
Spacer widget 以灰色背景显示,例如没有子节点的 `SizedBox`:
### Show baselines
### 显示基线
This option makes all baselines visible.
Baselines are horizontal lines used to position text.
此选项使所有基线可见。基线是用于定位文本的水平线。
This can be useful for checking whether text is precisely aligned vertically.
For example, the text baselines in the following screenshot are slightly misaligned:
可用于检查文本是否精确垂直对齐。
例如,以下截图中的文本基线略有错位:

The [Baseline][] widget can be used to adjust baselines.
可使用 [Baseline][] widget 调整基线。
[Baseline]: https://api.flutter-io.cn/flutter/widgets/Baseline-class.html
A line is drawn on any [render box][] that has a baseline set;
alphabetic baselines are shown as green and ideographic as yellow.
任何设置了基线的 [render box][] 都会绘制线条;
字母基线为绿色,表意基线为黄色。
You can also enable this in code:
也可以在代码中启用:
```dart
import 'package:flutter/rendering.dart';
void showBaselines() {
debugPaintBaselinesEnabled = true;
}
```
### Highlight repaints
### 高亮重绘
This option draws a border around all [render boxes][]
that changes color every time that box repaints.
此选项为所有 [render boxes][] 绘制边框,每次重绘时边框颜色都会变化。
[render boxes]: https://api.flutter-io.cn/flutter/rendering/RenderBox-class.html
This rotating rainbow of colors is useful for finding parts of your app
that are repainting too often and potentially harming performance.
这种旋转的彩虹色有助于找出应用中重绘过于频繁、可能影响性能的部分。
For example, one small animation could be causing an entire page
to repaint on every frame.
Wrapping the animation in a [RepaintBoundary widget][] limits
the repainting to just the animation.
例如,一个小动画可能导致整页在每一帧都重绘。
将动画包裹在 [RepaintBoundary widget][] 中可将重绘限制在动画区域。
[RepaintBoundary widget]: https://api.flutter-io.cn/flutter/widgets/RepaintBoundary-class.html

Here the progress indicator causes its container to repaint:
此处进度指示器导致其容器重绘:
```dart
class EverythingRepaintsPage extends StatelessWidget {
const EverythingRepaintsPage({super.key});
@override
Widget build(BuildContext context) {
return Scaffold(
appBar: AppBar(title: const Text('Repaint Example')),
body: const Center(child: CircularProgressIndicator()),
);
}
}
```

Wrapping the progress indicator in a `RepaintBoundary` causes
only that section of the screen to repaint:
将进度指示器包裹在 `RepaintBoundary` 中后,仅屏幕该区域会重绘:
```dart
class AreaRepaintsPage extends StatelessWidget {
const AreaRepaintsPage({super.key});
@override
Widget build(BuildContext context) {
return Scaffold(
appBar: AppBar(title: const Text('Repaint Example')),
body: const Center(
child: RepaintBoundary(child: CircularProgressIndicator()),
),
);
}
}
```
`RepaintBoundary` widgets have tradeoffs. They can help with performance,
but they also have an overhead of creating a new canvas,
which uses additional memory.
`RepaintBoundary` widget 有取舍:有助于性能,但创建新 canvas 也有开销,会占用额外内存。
You can also enable this option in code:
也可以在代码中启用此选项:
```dart
import 'package:flutter/rendering.dart';
void highlightRepaints() {
debugRepaintRainbowEnabled = true;
}
```
### Highlight oversized images
### 高亮过大图片
This option highlights images that are too large by both inverting their colors
and flipping them vertically:
此选项通过反色并垂直翻转来高亮过大的图片:

The highlighted images use more memory than is required;
for example, a large 5MB image displayed at 100 by 100 pixels.
被高亮的图片占用的内存超过所需;例如 5MB 大图以 100×100 像素显示。
Such images can cause poor performance, especially on lower-end devices
and when you have many images, as in a list view,
this performance hit can add up.
Information about each image is printed in the debug console:
此类图片可能导致性能不佳,尤其在低端设备上;
列表视图中图片很多时,性能影响会累积。
每张图片的信息会打印在调试控制台中:
```console
dash.png has a display size of 213×392 but a decode size of 2130×392, which uses an additional 2542KB.
```
Images are deemed too large if they use at least 128KB more than required.
若图片比所需多占用至少 128KB,则视为过大。
#### Fixing images
#### 修复图片
Wherever possible, the best way to fix this problem is resizing
the image asset file so it's smaller.
尽可能缩小图片资源文件是修复此问题的最佳方式。
If this isn't possible, you can use the `cacheHeight` and `cacheWidth`
parameters on the `Image` constructor:
若无法做到,可在 `Image` 构造函数上使用 `cacheHeight` 和 `cacheWidth` 参数:
```dart
class ResizedImage extends StatelessWidget {
const ResizedImage({super.key});
@override
Widget build(BuildContext context) {
return Image.asset('dash.png', cacheHeight: 213, cacheWidth: 392);
}
}
```
This makes the engine decode this image at the specified size,
and reduces memory usage (decoding and storage is still more expensive
than if the image asset itself was shrunk).
The image is rendered to the constraints of the layout or width and height
regardless of these parameters.
这会使引擎按指定尺寸解码图片并减少内存占用
(解码与存储仍比直接缩小资源更耗资源)。
无论这些参数如何,图片仍按布局约束或宽高渲染。
This property can also be set in code:
此属性也可在代码中设置:
```dart
void showOversizedImages() {
debugInvertOversizedImages = true;
}
```
#### More information
#### 更多信息
You can learn more at the following link:
可在以下链接了解更多:
* [Flutter documentation: debugInvertOversizedImages](https://api.flutter-io.cn/flutter/rendering/debugInvertOversizedImages.html)
[Flutter 文档:debugInvertOversizedImages](https://api.flutter-io.cn/flutter/rendering/debugInvertOversizedImages.html)
[render box]: https://api.flutter-io.cn/flutter/rendering/RenderBox-class.html
## Details Tree
## 详情树
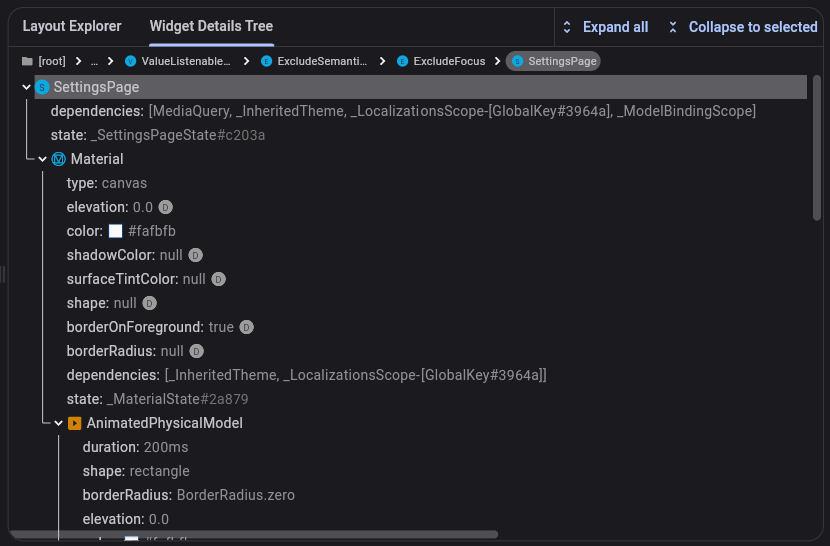
Select the **Widget Details Tree** tab to display the details tree for the
selected widget. From here, you can gather useful information about a
widget's properties, render object, and children.
选择 **Widget Details Tree**(Widget 详情树)标签页可显示所选 widget 的详情树。
在此可收集 widget 属性、render object 和子节点等有用信息。
{:width="100%"}
## Track widget creation
## 跟踪 widget 创建
Part of the functionality of the Flutter inspector is based on
instrumenting the application code in order to better understand
the source locations where widgets are created. The source
instrumentation allows the Flutter inspector to present the
widget tree in a manner similar to how the UI was defined
in your source code. Without it, the tree of nodes in the
widget tree are much deeper, and it can be more difficult to
understand how the runtime widget hierarchy corresponds to
your application's UI.
Flutter 检查器的部分功能基于对应用代码插桩,
以更好理解 widget 的创建源码位置。源码插桩使检查器能以
接近源码中 UI 定义的方式呈现 widget 树。
若无此功能,widget 树中的节点层级更深,
更难理解运行时 widget 层级与应用 UI 的对应关系。
You can disable this feature by passing `--no-track-widget-creation` to
the `flutter run` command.
可向 `flutter run` 命令传入 `--no-track-widget-creation` 禁用此功能。
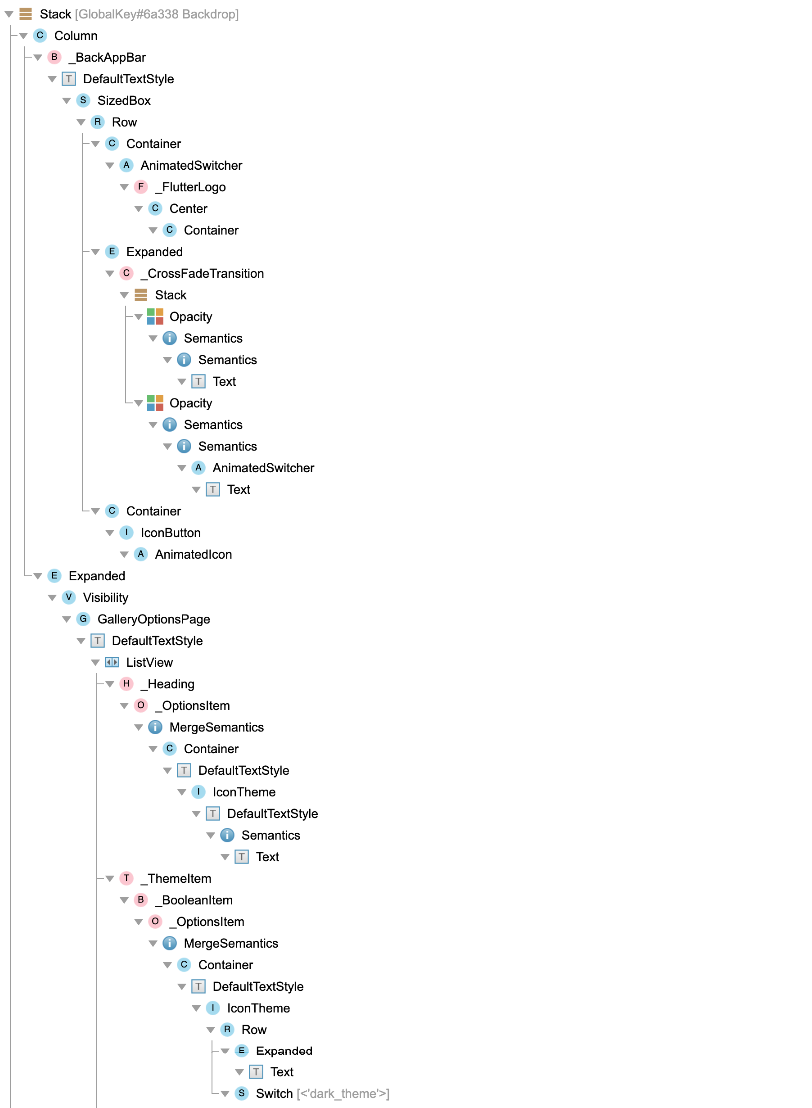
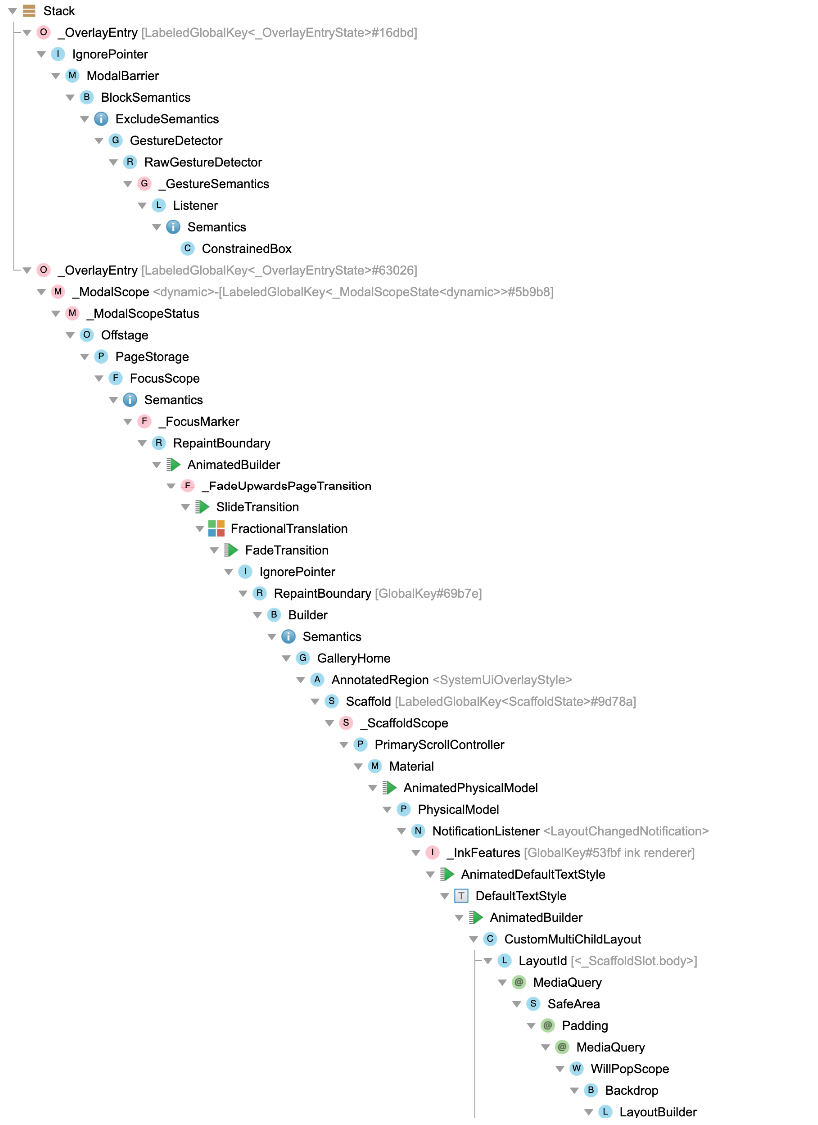
Here are examples of what your widget tree might look like
with and without track widget creation enabled.
以下是启用与禁用跟踪 widget 创建时 widget 树的可能外观示例。
Track widget creation enabled (default):
启用跟踪 widget 创建(默认):
{:width="100%"}
Track widget creation disabled (not recommended):
禁用跟踪 widget 创建(不推荐):
{:width="100%"}
This feature prevents otherwise-identical `const` Widgets from
being considered equal in debug builds. For more details, see
the discussion on [common problems when debugging][].
此功能会阻止原本相同的 `const` Widget 在调试构建中被视为相等。
更多细节请参阅 [common problems when debugging][](调试时的常见问题)讨论。
## Inspector settings
## 检查器设置
{:width="100%"}
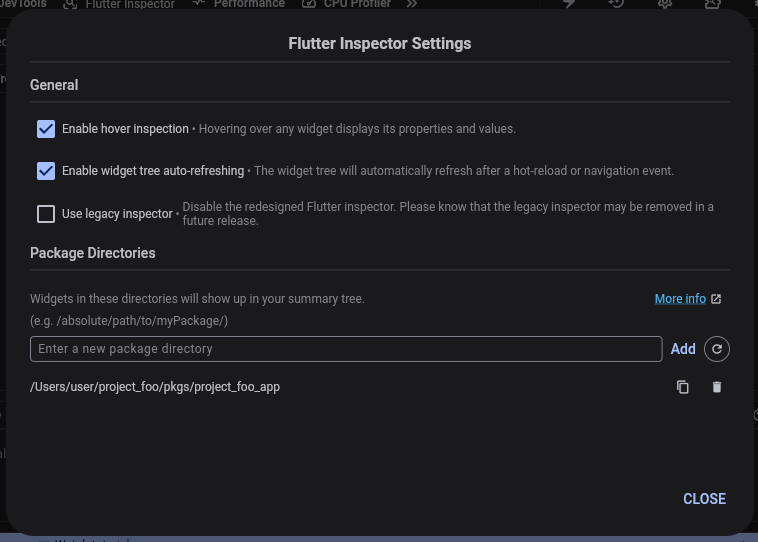
### Enable hover inspection
### 启用悬停检查
Hovering over any widget displays its properties and values.
将指针悬停在任意 widget 上会显示其属性与值。
Toggling this value enables or disables the hover inspection functionality.
切换此值可启用或禁用悬停检查功能。
### Package directories
### Package 目录
By default, DevTools limits the widgets displayed in the widget tree
to those from the project's root directory, and those from Flutter. This
filtering only applies to the widgets in the Inspector Widget Tree (left side
of the Inspector)—not the Widget Details Tree (right side of the Inspector
in the same tab view as the Layout Explorer).
In the Widget Details Tree,
you can see all widgets in the tree from all packages.
默认情况下,DevTools 将 widget 树中显示的 widget 限制为
项目根目录和 Flutter 中的 widget。此筛选仅适用于
检查器 Widget 树(检查器左侧)——不适用于与布局浏览器
同标签页中检查器右侧的 Widget 详情树。
在 Widget 详情树中,你可以看到所有 package 中树上的全部 widget。
In order to show other widgets,
a parent directory of theirs must
be added to the Package Directories.
要显示其他 widget,必须将其父目录添加到 package 目录 (Package Directories)。
For example, consider the following directory structure:
例如,考虑以下目录结构:
```plaintext
project_foo
pkgs
project_foo_app
widgets_A
widgets_B
```
Running your app from `project_foo_app` displays only widgets from
`project_foo/pkgs/project_foo_app` in the widget inspector tree.
从 `project_foo_app` 运行应用时,widget 检查器树中仅显示
`project_foo/pkgs/project_foo_app` 中的 widget。
To show widgets from `widgets_A` in the widget tree,
add `project_foo/pkgs/widgets_A` to the package directories.
要在 widget 树中显示 `widgets_A` 的 widget,
请将 `project_foo/pkgs/widgets_A` 添加到 package 目录。
To display _all_ widgets from your project root in the widget tree,
add `project_foo` to the package directories.
要在 widget 树中显示项目根目录的 **全部** widget,
请将 `project_foo` 添加到 package 目录。
Changes to your package directories persist the next time the
widget inspector is opened for the app.
对 package 目录的更改会在下次为该应用打开 widget 检查器时保留。
## Other resources
## 其他资源
For a demonstration of what's generally possible with the inspector,
see the [DartConf 2018 talk][] demonstrating the IntelliJ version
of the Flutter inspector.
有关检查器一般能力的演示,
请参阅展示 IntelliJ 版 Flutter 检查器的 [DartConf 2018 talk][]。
To learn how to visually debug layout issues
using DevTools, check out a guided
[Flutter Inspector tutorial][inspector-tutorial].
要了解如何使用 DevTools 可视化调试布局问题,
请参阅引导式 [Flutter Inspector tutorial][inspector-tutorial](Flutter 检查器教程)。
[`Column`]: https://api.flutter-io.cn/flutter/widgets/Column-class.html
[common problems when debugging]: /testing/debugging
[`crossAxisAlignment`]: https://api.flutter-io.cn/flutter/widgets/Flex/crossAxisAlignment.html
[DartConf 2018 talk]: https://www.youtube.com/watch?v=JIcmJNT9DNI
[debug mode]: /testing/build-modes#debug
[`Flex`]: https://api.flutter-io.cn/flutter/widgets/Flex-class.html
[flex layouts]: https://api.flutter-io.cn/flutter/widgets/Flex-class.html
[`FlexFit`]: https://api.flutter-io.cn/flutter/rendering/FlexFit.html
[`FlexParentData.fit`]: https://api.flutter-io.cn/flutter/rendering/FlexParentData/fit.html
[`FlexParentData.flex`]: https://api.flutter-io.cn/flutter/rendering/FlexParentData/flex.html
[`mainAxisAlignment`]: https://api.flutter-io.cn/flutter/widgets/Flex/mainAxisAlignment.html
[`mainAxisSize`]: https://api.flutter-io.cn/flutter/widgets/Flex/mainAxisSize.html
[`Row`]: https://api.flutter-io.cn/flutter/widgets/Row-class.html
[`textDirection`]: https://api.flutter-io.cn/flutter/widgets/Flex/textDirection.html
[Understanding constraints]: /ui/layout/constraints
[inspector-tutorial]: https://medium.com/@fluttergems/mastering-dart-flutter-devtools-flutter-inspector-part-2-of-8-bbff40692fc7